# noaa-tides
MCP server for [NOAA CO-OPS Tides and Currents](https://tidesandcurrents.noaa.gov/). Exposes tide predictions, observed water levels, and meteorological data from ~301 U.S. coastal stations as tools, resources, and prompts via [FastMCP 3.0](https://gofastmcp.com/).
Built for marine planning — fishing trips, boating, crabbing, safety checks.
## Install
```bash
# Run directly (no install needed)
uvx noaa-tides
# Or add to Claude Code
claude mcp add noaa-tides -- uvx noaa-tides
# With visualization support (charts)
uv pip install noaa-tides[viz]
# Local development
uv run noaa-tides
```
## Tools
### `search_stations` — Find stations by name, state, or type
```
search_stations(state="WA")
```
Returns up to 50 matching stations:
```json
[
{"id": "9447130", "name": "Seattle", "state": "WA", "lat": 47.6026, "lng": -122.3393, "tidal": true},
{"id": "9446484", "name": "Tacoma", "state": "WA", "lat": 47.2671, "lng": -122.4132, "tidal": true},
{"id": "9444900", "name": "Port Townsend", "state": "WA", "lat": 48.1129, "lng": -122.7595, "tidal": true}
]
```
Also supports `query` (name search) and `is_tidal` (filter tidal vs non-tidal).
### `find_nearest_stations` — Proximity search by coordinates
```
find_nearest_stations(latitude=47.6, longitude=-122.34, limit=3)
```
Distances in nautical miles:
```json
[
{"id": "9447130", "name": "Seattle", "state": "WA", "lat": 47.6026, "lng": -122.3393, "distance_nm": 0.2},
{"id": "9446484", "name": "Tacoma", "state": "WA", "lat": 47.2671, "lng": -122.4132, "distance_nm": 20.1},
{"id": "9445958", "name": "Bremerton", "state": "WA", "lat": 47.5615, "lng": -122.6225, "distance_nm": 14.7}
]
```
### `get_station_info` — Expanded station metadata
```
get_station_info(station_id="9447130")
```
Returns sensors, datums, products, and station details. Seattle has been operating since 1899.
Full response (194 lines)
See [`examples/station-detail-seattle.json`](examples/station-detail-seattle.json)
### `get_tide_predictions` — High/low tide times
```
get_tide_predictions(station_id="9447130", hours=24)
```
Defaults to `hilo` interval (high/low times only) — the most useful format for planning:
```json
{
"predictions": [
{"t": "2026-02-21 00:49", "v": "2.658", "type": "L"},
{"t": "2026-02-21 07:08", "v": "12.261", "type": "H"},
{"t": "2026-02-21 13:43", "v": "1.167", "type": "L"},
{"t": "2026-02-21 19:54", "v": "9.857", "type": "H"}
]
}
```
`type`: `H` = high tide, `L` = low tide. Values in feet above MLLW.
Other intervals: `"h"` (hourly), `"6"` (6-minute). Datum options: `MLLW`, `MSL`, `NAVD`, `STND`.
### `get_observed_water_levels` — Actual readings
```
get_observed_water_levels(station_id="9447130", hours=3)
```
6-minute interval observations. Compare with predictions to see how reality diverges:
```json
{
"metadata": {"id": "9447130", "name": "Seattle", "lat": "47.6026", "lon": "-122.3393"},
"data": [
{"t": "2026-02-21 17:24", "v": "7.41", "s": "0.059", "f": "0,0,0,0", "q": "p"},
{"t": "2026-02-21 17:30", "v": "7.62", "s": "0.072", "f": "0,0,0,0", "q": "p"},
{"t": "2026-02-21 17:36", "v": "7.803", "s": "0.069", "f": "0,0,0,0", "q": "p"}
]
}
```
`q`: `"p"` = preliminary (real-time), `"v"` = verified (post-processed). `s` = standard deviation.
Full 3-hour response (213 lines)
See [`examples/water-levels-seattle.json`](examples/water-levels-seattle.json)
### `get_meteorological_data` — Weather observations
One tool, 8 products. Select via `product` parameter:
| Product | Fields | Units |
|---------|--------|-------|
| `air_temperature` | `v` | deg F |
| `water_temperature` | `v` | deg F |
| `wind` | `s` (speed), `d` (dir deg), `dr` (compass), `g` (gust) | knots |
| `air_pressure` | `v` | millibars |
| `conductivity` | `v` | mS/cm |
| `visibility` | `v` | nautical miles |
| `humidity` | `v` | percent |
| `salinity` | `v` | PSU |
```
get_meteorological_data(station_id="8454000", product="wind", hours=1)
```
```json
{
"metadata": {"id": "8454000", "name": "Providence", "lat": "41.8072", "lon": "-71.4007"},
"data": [
{"t": "2026-02-21 22:24", "s": "2.72", "d": "109.0", "dr": "ESE", "g": "3.3", "f": "0,0"},
{"t": "2026-02-21 22:30", "s": "3.3", "d": "103.0", "dr": "ESE", "g": "3.89", "f": "0,0"},
{"t": "2026-02-21 22:36", "s": "2.72", "d": "108.0", "dr": "ESE", "g": "3.5", "f": "0,0"}
]
}
```
Not all stations support all products — use `get_station_info` to check available sensors.
### `marine_conditions_snapshot` — Everything at once
```
marine_conditions_snapshot(station_id="9447130")
```
Fires 6 parallel API calls (predictions, water level, water temp, air temp, wind, pressure) and returns a combined snapshot. Products that aren't available at a station appear under `unavailable` instead of failing the whole request:
```json
{
"station_id": "9447130",
"fetched_utc": "2026-02-22T04:15:38.291Z",
"predictions": {"predictions": [{"t": "...", "v": "12.261", "type": "H"}, "..."]},
"water_level": {"data": [{"t": "...", "v": "10.22", "s": "0.053", "f": "0,0,0,0", "q": "p"}, "..."]},
"air_pressure": {"data": [{"t": "...", "v": "1012.4", "f": "0,0,0"}, "..."]},
"unavailable": {
"water_temperature": "ValueError: No data was found...",
"air_temperature": "ValueError: No data was found...",
"wind": "ValueError: No data was found..."
}
}
```
Best starting point for trip planning or safety assessments.
### `visualize_tides` — Tide prediction chart
```
visualize_tides(station_id="9447130", hours=48, format="png")
```
Generates a tide prediction chart with the water level curve, high/low markers, and optional observed water level overlay. PNG returns an inline image via MCP; HTML saves an interactive Plotly chart to `artifacts/charts/`.
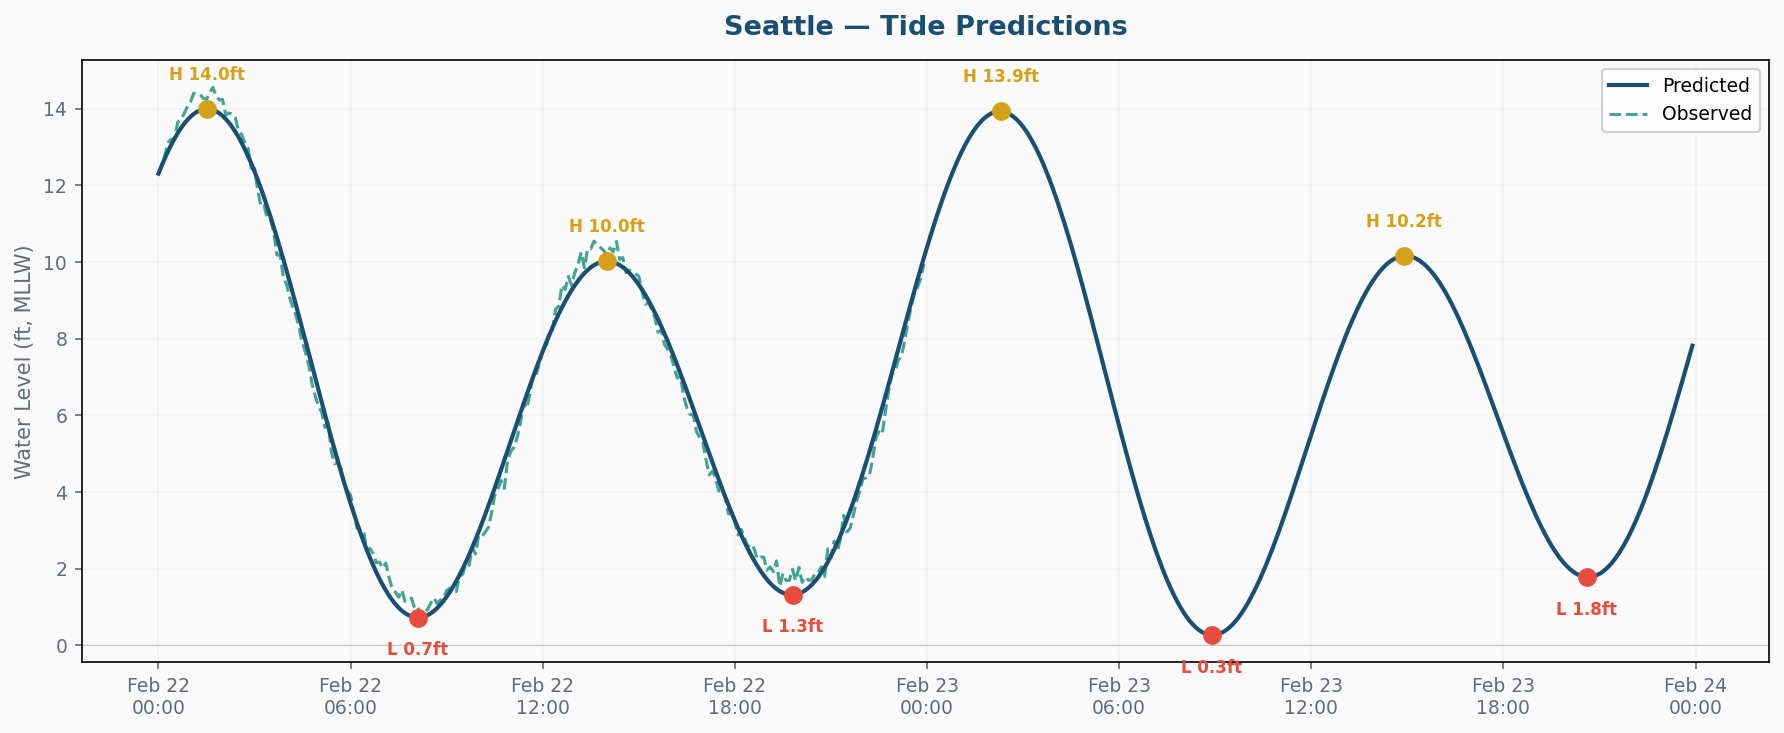
Parameters:
- `hours` — forecast window (default 48)
- `include_observed` — overlay actual readings (default true)
- `format` — `"png"` (inline image) or `"html"` (interactive file)
Requires `noaa-tides[viz]` — install with `uv pip install noaa-tides[viz]`.
### `visualize_conditions` — Multi-panel conditions dashboard
```
visualize_conditions(station_id="9447130", hours=24, format="png")
```
Generates a multi-panel dashboard with up to 4 panels: tide predictions + observed overlay, wind speed/gust, air/water temperature, and barometric pressure with trend indicator. Products unavailable at a station are omitted.
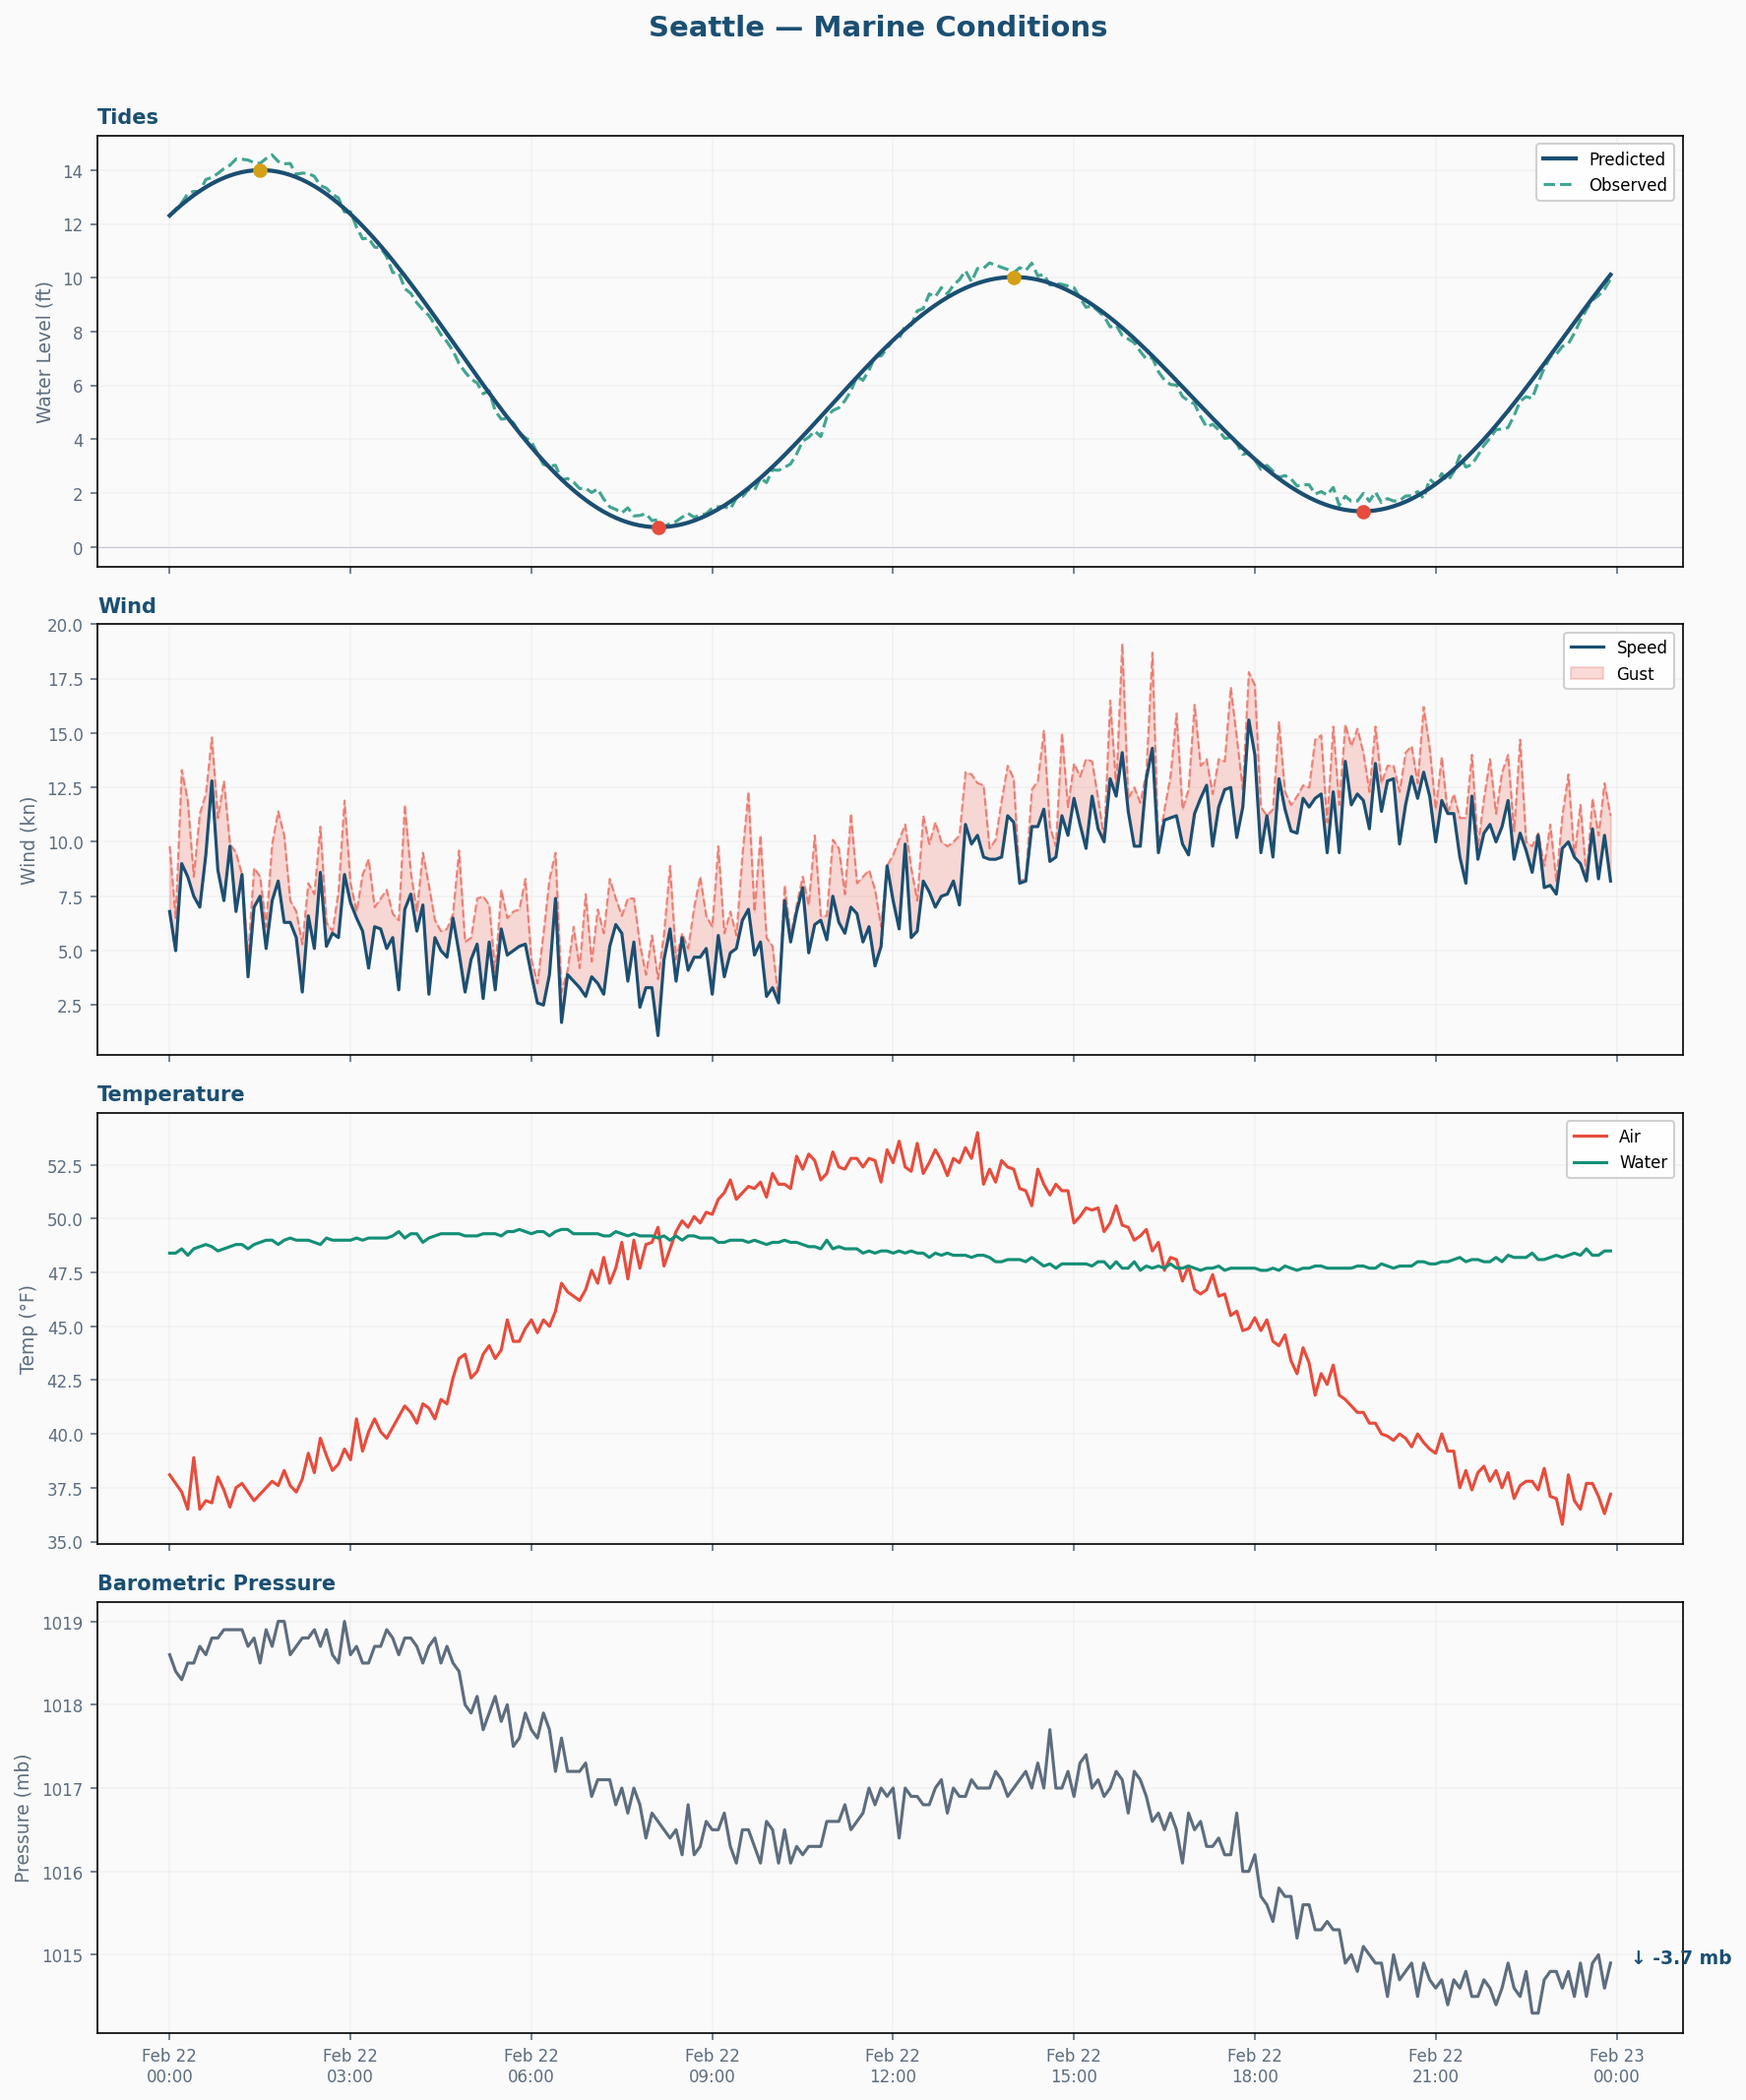
Parameters:
- `hours` — data window (default 24)
- `format` — `"png"` (inline image) or `"html"` (interactive file)
Requires `noaa-tides[viz]`.
## Resources
| URI | Description |
|-----|-------------|
| `noaa://stations` | Full station catalog (~301 stations) |
| `noaa://stations/{station_id}` | Expanded metadata for one station |
| `noaa://stations/{station_id}/nearby` | Stations within 50 nm |
## Prompts
### `plan_fishing_trip`
Guides the LLM through station discovery, tide analysis, and weather assessment to recommend optimal fishing windows.
```
plan_fishing_trip(location="Narragansett Bay", target_species="striped bass", date="20260615")
```
### `marine_safety_check`
GO / CAUTION / NO-GO assessment based on wind, visibility, water temperature, and pressure trends.
```
marine_safety_check(station_id="9447130")
```
## Response field reference
| Field | Meaning |
|-------|---------|
| `t` | Timestamp (local station time) |
| `v` | Value (water level ft, temp F, pressure mb, etc.) |
| `type` | `H` (high) or `L` (low) — predictions only |
| `s` | Speed (wind, knots) or sigma (water level, std deviation) |
| `d` | Wind direction in degrees true |
| `dr` | Wind compass direction (N, NE, SW, etc.) |
| `g` | Wind gust speed (knots) |
| `f` | Data quality flags (comma-separated) |
| `q` | QA level: `p` = preliminary, `v` = verified |
## Development
```bash
git clone && cd noaa-tides
uv sync --dev
# Run tests (mock client, no network)
uv run pytest tests/ -v
# Lint
uv run ruff check src/
# Start server locally
uv run noaa-tides
# Headless test with Claude
claude -p "Search for tide stations in Rhode Island" \
--mcp-config .mcp.json \
--allowedTools "mcp__noaa-tides__*"
```
## Data source
All data from [NOAA Center for Operational Oceanographic Products and Services (CO-OPS)](https://tidesandcurrents.noaa.gov/). No API key required. Station IDs are 7-digit numbers (e.g. `9447130` for Seattle, `8454000` for Providence).
Two separate APIs are used:
- **Data API** — observations and predictions (`api.tidesandcurrents.noaa.gov/api/prod/datagetter`)
- **Metadata API** — station info, sensors, datums (`api.tidesandcurrents.noaa.gov/mdapi/prod/webapi`)
## License
MIT